Documentation, a tedious task but essential to every piece of technology. Tabular models are no exception to this rule. They contain business rules, calculations, relationships, columns, etcetera. This level of complexity can often cause confusion for the users of these models.
To mitigate this we could direct users to the slightly outdated 50+ page documentation, hidden somewhere in the dark corners of an archive. However, we can also choose to make life a bit easier for them.
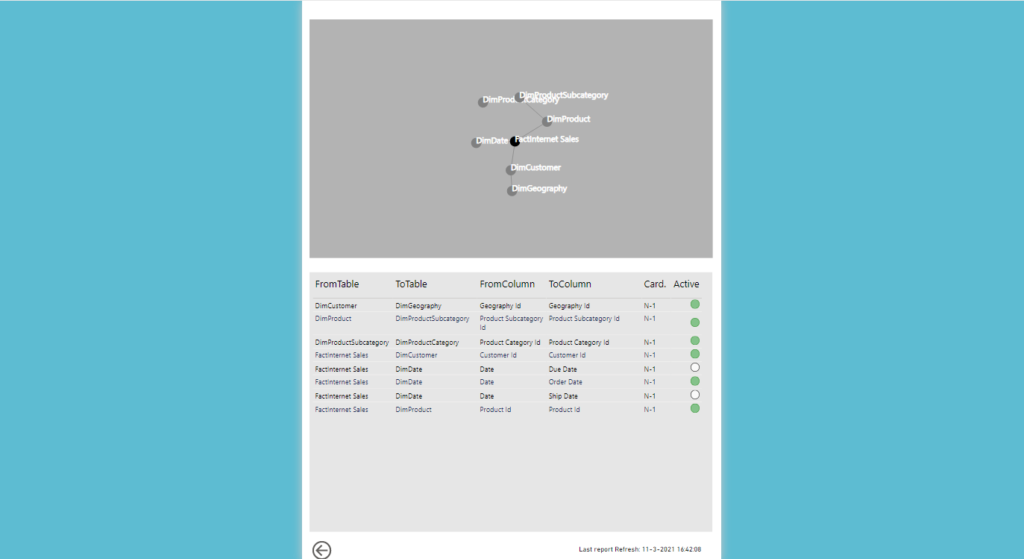
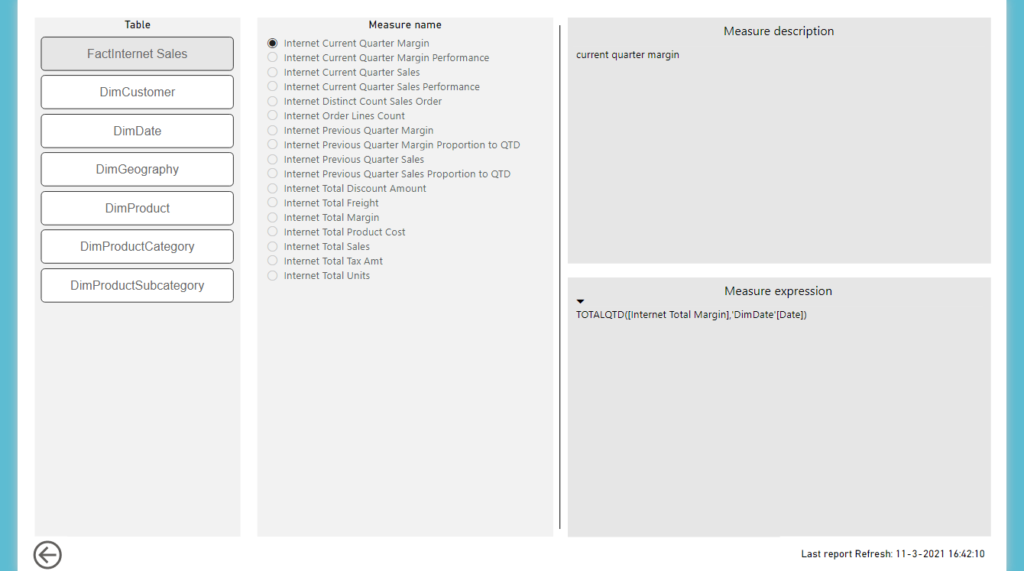
Enter Dynamic management views. DMV’s are queries within the analysis services database that contain information about model objects. For example, the “$SYSTEM.TMSCHEMA_MEASURES” DMV contains the metadata of all measures within your tabular model (think of expressions, descriptions, and other properties). By Combining multiple of these DMV’s together we can create a pretty solid overview of our tabular model content.
Power BI then allows us to shape this data into a fancy, easily accessible, and refreshable report. Both end-users and developers will now have access to an up-to-date overview of their datamodel content with just one click.
Since the DMV’s are common to every tabular model, the report does not require significant alterations when applied to a different model. Simply update the server and database parameters and you’re good to go.


Interested in a copy of ther report? Send me a message!
Requirements:
- (Azure) analysis services
- Power BI
- DMV: $SYSTEM.TMSCHEMA_MEASURES
- DMV: $SYSTEM.TMSCHEMA_COLUMNS
- DMV: $SYSTEM.TMSCHEMA_TABLES
- DMV: $SYSTEM.TMSCHEMA_RELATIONSHIPS
