Some basic tips & tricks to help you add some spice to your reports and dashboards.
Category: Visualization
Visualization related posts

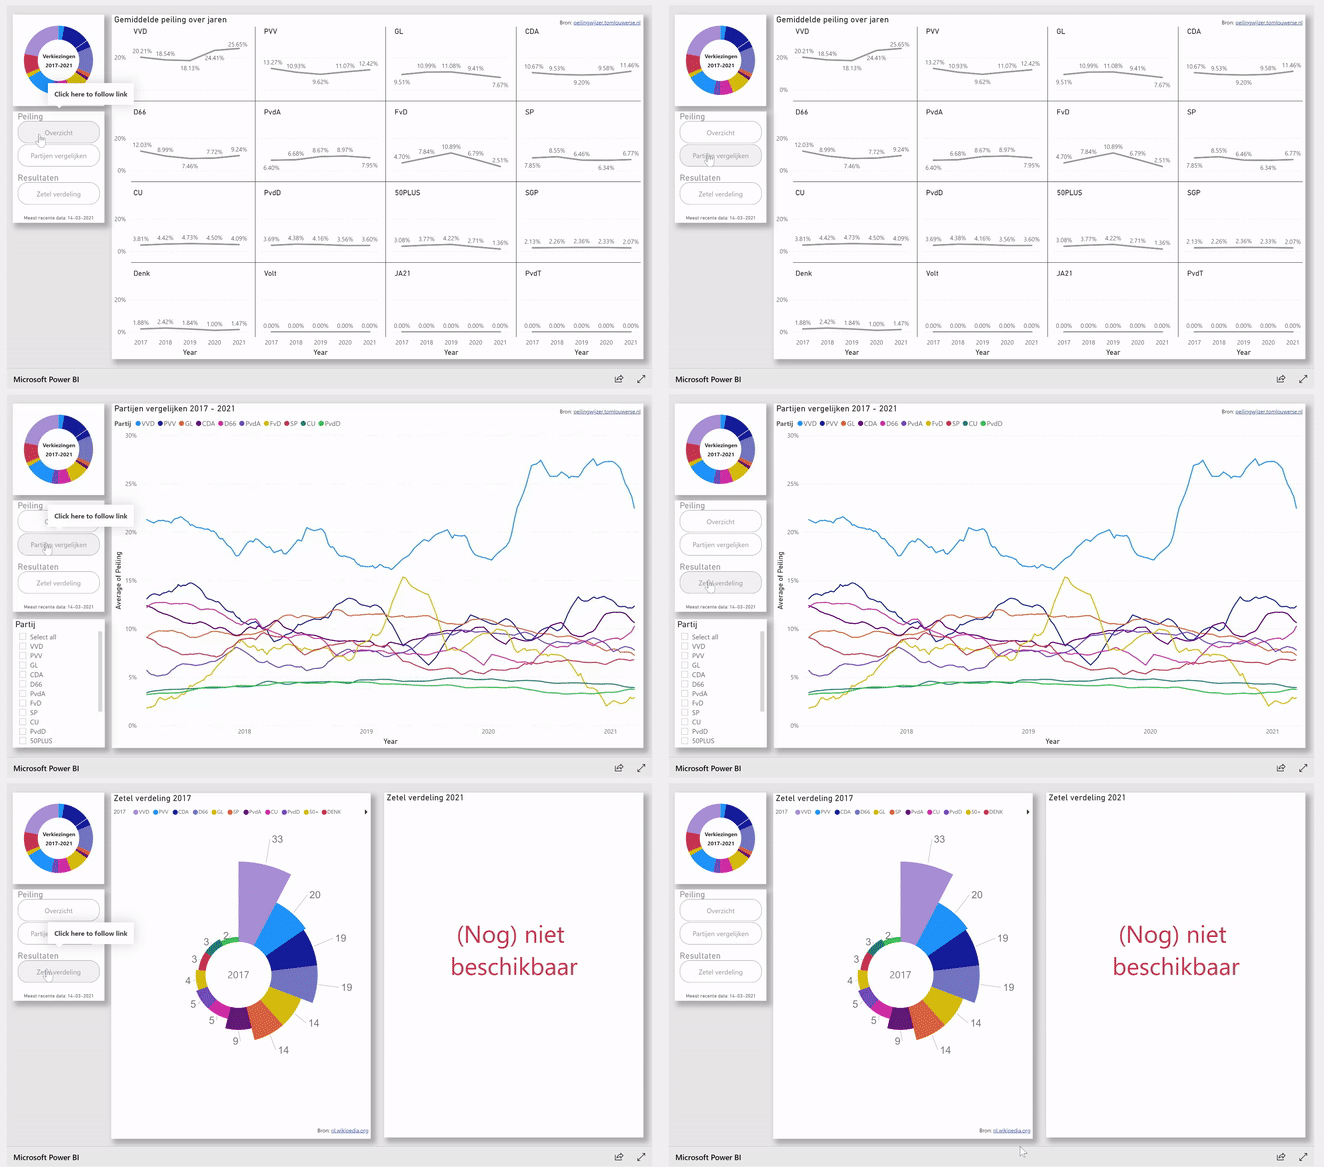
Dutch elections 2021
My attempt at visualizing some of the 2021 Dutch election polling and results.

The tabular (meta)model
Is your tabular model getting out of hand? Maybe this will help!

